This page is outdated, please also see the man page.
How to run a permutation pass in cis?
To perform a permutation based analysis on your data set in order to get adjusted P-values of association between the phenotypes and the top variants in cis, you need the following input files:
- An indexed phenotype data matrix in BED format (see section Preparing input files)
- An indexed genotype data matrix in VCF/BCF format (see section Preparing input files)
- A covariate data matrix in TXT format (see section Preparing input files)
1. Standard permutation pass
For simplicitly, we provide the following small example files:
- The phenotype data matrix for chr22 on 358 samples: BED / index
- The genotype data matrix for chr22 on 358 samples: VCF / index
- The covariate data matrix on 358 samples: TXT
Then, you can run a permutation pass of the data in a particular genomic region using:
QTLtools cis --vcf genotypes.chr22.vcf.gz --bed genes.50percent.chr22.bed.gz --cov genes.covariates.pc50.txt.gz --permute 1000 --region chr22:17000000-18000000 --out permutations.txt
The given options are:
- --permute 1000 to perform 1,000 permutations of the phenotypes corrected for covariates
- --region chr22:17000000-18000000 to only process phenotypes which locations are within the specified genomic region
The output file permutations.txt looks like this:
		ENSG00000237438.2 chr22 17517460 17517460 + 5803 25350 rs2845402 chr22 17542810 17542810 356 307.641 1.0758 606.072 1.1864e-25 -0.751804 0.000999001 4.79271e-21

		ENSG00000273203.1 chr22 17548711 17548711 + 5889 -31323 rs3016112 chr22 17517388 17517388 356 305.346 1.05214 604.311 5.86611e-06 -0.140609 0.00999001 0.0128458

		ENSG00000273442.1 chr22 17561591 17561591 + 5911 -8065 rs73149812 chr22 17553526 17553526 356 308.754 1.08518 661.618 0.000244522 0.134045 0.318681 0.304744

		ENSG00000177663.9 chr22 17565844 17565844 + 5919 -52141 rs2908526 chr22 17513703 17513703 356 333.628 0.998034 982.885 8.03358e-14 -0.209617 0.000999001 4.92276e-10

		ENSG00000183307.3 chr22 17602257 17602257 - 5967 14282 rs6518661 chr22 17587975 17587975 356 335.297 0.983505 921.283 1.56789e-07 -0.00776053 0.000999001 0.00038022

		ENSG00000069998.8 chr22 17646177 17646177 - 6044 3400 rs71200232 chr22 17642776 17642777 356 332.081 1.03052 958.093 8.87771e-17 -1.49798 0.000999001 3.8205e-13

		ENSG00000093072.11 chr22 17702879 17702879 - 6048 3249 rs5747027 chr22 17699630 17699630 356 287.216 1.02518 511.292 0.000578649 0.640374 0.628372 0.629492

		ENSG00000099954.14 chr22 17840837 17840837 + 6200 -664900 rs138493943 chr22 17175937 17175937 356 237.501 0.927455 289.487 0.000866455 0.00673291 0.874126 0.86718
The columns are:
- 1. The phenotype ID
- 2. The chromosome ID of the phenotype
- 3. The start position of the phenotype
- 4. The end position of the phenotype
- 5. The strand orientation of the phenotype
- 6. The total number of variants tested in cis
- 7. The distance between the phenotype and the tested variant (accounting for strand orientation)
- 8. The ID of the top variant
- 9. The chromosome ID of the top variant
- 10. The start position of the top variant
- 11. The end position of the top variant
- 12. The number of degrees of freedom used to compute the P-values
- 13. Dummy
- 14. The first parameter value of the fitted beta distribution
- 15. The second parameter value of the fitted beta distribution (it also gives the effective number of independent tests in the region)
- 16. The nominal P-value of association between the phenotype and the top variant in cis
- 17. The corresponding regression slope
- 18. The P-value of association adjusted for the number of variants tested in cis given by the direct method (i.e. empirircal P-value)
- 19. The P-value of association adjusted for the number of variants tested in cis given by the fitted beta distribution. We strongly recommend to use this adjusted P-value in any downstream analysis
If needed, you can either increase or decrease the number of permutations using (here set to 10,000):
QTLtools cis --vcf genotypes.chr22.vcf.gz --bed genes.50percent.chr22.bed.gz --cov genes.covariates.pc50.txt.gz --permute 10000 --region chr22:17000000-18000000 --out permutations.txt
In order to perform a fast permutation pass for testing purpose, you can use --permute 100 which will already give reasonnable estimate of adjusted P-values via beta distributions.
Similarly to a nominal pass, you can enforce your phenotypes to match normal distributions N(0, 1) and change the cis-window size by using:
QTLtools cis --vcf genotypes.chr22.vcf.gz --bed genes.50percent.chr22.bed.gz --cov genes.covariates.pc50.txt.gz --permute 1000 --region chr22:17000000-18000000 --out permutations.txt --normal --window 2000000
To change the seed of the random number generator, which is particularly useful to replicate analyses, use:
QTLtools cis --vcf genotypes.chr22.vcf.gz --bed genes.50percent.chr22.bed.gz --cov genes.covariates.pc50.txt.gz --permute 1000 --region chr22:17000000-18000000 --out permutations.txt --seed 123456
Here also, samples, variants, phenotypes or covariates can be excluded from the analysis using one of these options (see the section about the nominal pass for more details):
- To exclude samples: --exclude-samples file.exc
- To exclude variants: --exclude-sites file.exc
- To exclude phenotypes: --exclude-phenotypes file.exc
- To exclude caovariates: --exclude-covariates file.exc
2. Important notes on parallelization
To facilitate parallelization on compute cluster, we developed an option to run the analysis into chunks of molecular phenotypes. This is quite similar to what is commonly used for genotype imputation, where only small chunks of data are imputed one at a time in seperate jobs. However in practice, it is usually quite complicated to properly split the genome into a given number of chunks with correct coordinates. To facilitate this, we embedded all coordinates into a chunk-based system so that you only need to specify the chunk index you want to run. Then, splitting the genome into chunks, extraction of data, and analysis are automatically performed. For instance, to run analysis on chunk number 12 when splitting the example data set into 20 chunks, just run:
http://jungle.unige.ch/QTLtools_examples/exons.50percent.chr22.bed.gz
		QTLtools cis --vcf genotypes.chr22.vcf.gz --bed genes.50percent.chr22.bed.gz --cov genes.covariates.pc50.txt.gz --permute 1000 --chunk 12 20 --out permutations_12_20.txt
If you want to submit the whole analysis into 20 jobs on a compute cluster, just run:
		for j in $(seq 1 20); do

		     echo "QTLtools cis --vcf ... --bed ... --cov ... --permute 1000 --chunk $j 20 --out permutations_$j\_20.txt" | qsub

		done
Here qsub needs to be changed according to the job submission system used (bsub, psub, etc...).
Once all you chunks are processed, you can then merge all of them to build a unique output file using:
cat permutations_*_20.txt | gzip -c > permutations_full.txt.gz
3. Check that the beta approximated P-values are okay
To check that the beta approximated permutation p-values are well calibrated, load the data in R and make the following plot:
		R> d = read.table("permutations_full.txt.gz", hea=F, stringsAsFactors=F)

		R> plot(d$V18, d$V19, xlab="Direct method", ylab="Beta approximation", main="")

		R> abline(0, 1, col="red")
You should get something like this:
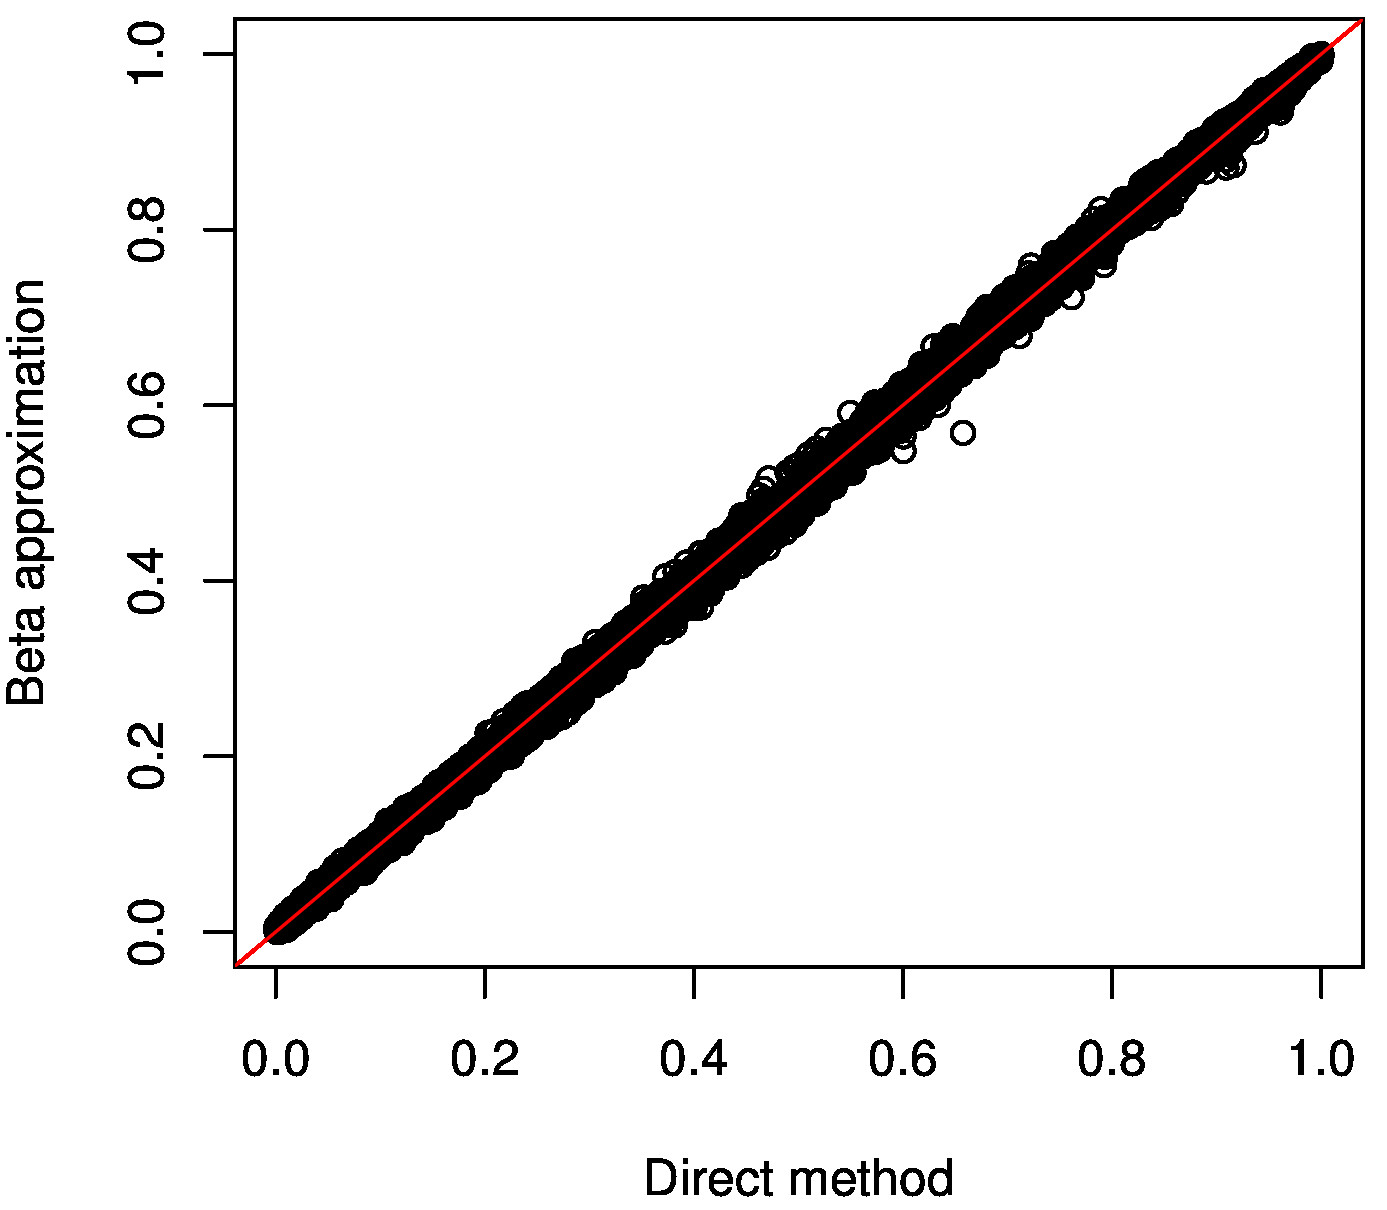
We expect here to get all points along the diagonal as on the plot above. This shows that unsignificant beta approximated p-values are well calibrated given the empirical ones.
4. Correct for the multiple phenotypes being tested
To account for the fact that multiple molecular phenotypes are tested whole genome, we need an additional level of multiple testing correction. To do so, we recommend to use the Storey & Tibshirani False Discovery Rate procedure implemented in the R/qvalue package as shown below:
First, download this example file that contains results for a whole genome analysis for 358 samples and 22,147 genes: DATA. Then, use R as follows:
		R> library(qvalue)
		R> d = read.table("results.genes.full.txt.gz", hea=FALSE, stringsAsFactors=FALSE)

		R> d=d[!is.na(d$V19),]

		R> d$qval=qvalue(d$V19)$qvalue

		R> write.table(d[which(d$qval <= 0.05), ], "results.genes.significant.txt", quote=FALSE, row.names=FALSE, col.names=FALSE)
This produces an output file results.genes.significant.txt that contains all significant phenotypes at 5% FDR in results.genes.full.txt.gz. For convenience, we also provide a R script runFDR.R located in the script folder of QTLtools that does this trick. To produce the output file results.genes.significant.txt at 5% FDR, use it as follows:
Rscript ./script/runFDR_cis.R results.genes.full.txt.gz 0.05 results.genes
Note that alternatively to R/qvalue, you can also use the various FDR procedures implemented in R/p.adjust.
5. Map QTLs for groups of phenotypes
When your phenotypes in the BED file are grouped (see section Preparing input files), you can perform a permutation pass at the phenotype group level in order to discover group-level QTLs. To illustrate this, please download a phenotype matrix that contains groups (i.e. genes) of phenotypes (i.e. exons): BED / index. Then, you can run a permutation for all genes in the genomic region [chr22:17000000-18000000] using:
QTLtools cis --vcf genotypes.chr22.vcf.gz --bed exons.50percent.chr22.bed.gz --cov genes.covariates.pc50.txt.gz --permute 1000 --region chr22:17000000-18000000 --grp-best --out permutations.group.txt
This will produce the following output file permutations.group.txt:
		ENSG00000237438.2 chr22 17517460 17517460 + ENSG00000237438.2_17537963_17540893 6 5803 25350 rs2845402 chr22 17542810 17542810 356 299.541 1.08226 2456.19 5.99043e-30 -1.01149 0.000999001 7.76962e-24

		ENSG00000273203.1 chr22 17548711 17548711 + ENSG00000273203.1_17548711_17551565 1 5889 -31323 rs3016112 chr22 17517388 17517388 356 305.346 1.05214 604.311 5.86611e-06 -0.140609 0.00999001 0.0128458

		ENSG00000273442.1 chr22 17561591 17561591 + ENSG00000273442.1_17561591_17562346 1 5911 -8065 rs73149812 chr22 17553526 17553526 356 308.754 1.08518 661.618 0.000244522 0.134045 0.318681 0.304744

		ENSG00000177663.9 chr22 17565844 17565844 + ENSG00000177663.9_17588617_17588658 13 5919 23365 rs879577 chr22 17589209 17589209 356 318.783 1.04364 9233.61 1.09512e-14 -0.564073 0.000999001 1.00321e-09

		ENSG00000183307.3 chr22 17602257 17602257 - ENSG00000183307.3_17597189_17602257 1 5967 14282 rs6518661 chr22 17587975 17587975 356 335.297 0.983505 921.283 1.56789e-07 -0.00776053 0.000999001 0.00038022

		ENSG00000069998.8 chr22 17646177 17646177 - ENSG00000069998.8_17630432_17630635 7 6044 15691 rs1034859 chr22 17630486 17630486 356 300.653 1.15824 3557.61 4.59119e-26 -3.0851 0.000999001 1.38277e-21

		ENSG00000093072.11 chr22 17702879 17702879 - ENSG00000093072.11_17669229_17669617 10 6048 33573 rs2231495 chr22 17669306 17669306 356 293.005 0.951732 2908.66 6.71901e-10 -0.503216 0.001998 0.000102004

		ENSG00000099954.14 chr22 17840837 17840837 + ENSG00000099954.14_18032535_18037850 1 6200 -664900 rs138493943 chr22 17175937 17175937 356 216.381 0.972885 228.553 0.000188795 0.00948545 0.565435 0.576148
This file is similar to the one given by a standard permutation pass, but it contains the following differences:
- 1. The phenotype group ID (here a gene ID)
- 2. The chromosome ID of the phenotype group
- 3. The start position of the phenotype group
- 4. The end position of the phenotype group
- 5. The strand orientation of the phenotype group
- 6. The top phenotype in the group (here an exon ID)
- 7. The total number of phenotypes in the group (i.e. #exons)
- 8. The total number of variants tested in cis
- 9. The distance between the phenotype group and the tested variant (accounting for strand orientation)
- 10. The ID of the top variant
- 11. The chromosome ID of the top variant
- 12. The start position of the top variant
- 13. The end position of the top variant
- 14. The number of degrees of freedom used to compute the P-values
- 15. Dummy
- 16. The first parameter value of the fitted beta distribution
- 17. The second parameter value of the fitted beta distribution (it also gives the effective number of independent tests in the region)
- 18. The nominal P-value of association between the top phenotype and the top variant in cis
- 19. The corresponding regression slope
- 20. The P-value of association adjusted for the number of variants and phenotypes tested in cis given by the direct method (i.e. empirircal P-value)
- 21. The P-value of association adjusted for the number of variants and phenotypes tested in cis given by the fitted beta distribution. We strongly recommend to use this adjusted P-value in any downstream analysis
We also implemented an alternative approach to collapse all phenotypes per group using the first principal component of a PCA. To use it, run:
QTLtools cis --vcf genotypes.chr22.vcf.gz --bed exons.50percent.chr22.bed.gz --cov genes.covariates.pc50.txt.gz --permute 1000 --region chr22:17000000-18000000 --grp-pca1 --out permutations.group.txt
The output is the same excepted that the 6th column does not contain the top phenotype but instead the variance explained by PC1.